SUMMARY – Bracing for a correction
Market Review: Global equities rallied for the fifth straight month in September, propelled by expectations for continued robust earnings growth, a resumption of interest rate cuts, and ongoing enthusiasm for artificial intelligence (AI)-related stocks. The TSX Composite rose 5.1% last month; the index’s 11.8% surge in Q3 was its best quarterly gain since Q2 of 2020, and its 22.1% advance YTD puts it on course for the biggest annual gain since 2009. U.S. indices also had a good month, with the S&P 500 and Nasdaq Composite posting their best September performance in 15 years with gains of 3.5% and 5.6%.
Outlook: The current bull market marked its third anniversary this month. Over this three-year period, the Nasdaq Composite soared 127% and the S&P 500 surged 88%. Can gains of that magnitude be sustained for a few more years? The evidence is mixed in this regard. Of the 13 prior bull markets in the S&P 500 since World War II, only seven completed a fourth year, with an average total gain of 88%. The S&P 500 has reached that threshold in just three years in the current bull market, with the index’s trailing P/E ratio of 25 the highest ever at this stage of the rally.
But the rally does have strong underpinnings in terms of corporate earnings. According to FactSet, the S&P 500 is likely to report earnings growth above 13% for the third quarter, which would be the fourth straight quarter of double-digit earnings growth. The TSX Composite and S&P 500 are expected to post similar earnings growth of 11% this year and 14% in 2026. Based on 2026 EPS forecasts, the TSX trades at a forward P/E of 16.1x, while the S&P 500 trades at 22.2x.
The rebound from the April lows is more like a relief rally than anything else, since the worst-case outcomes (i.e. a full-blown trade war, global recession) resulting from the tariffs have been averted. But we may not be totally out of the woods yet. The IMF and WTO expect growth to slow down in 2026, from an unexpectedly resilient 2025, as tariffs begin to have an impact. Also, the “circular” deals between AI leaders like Nvidia and OpenAI have led to escalating concerns that the AI boom is being propped up by interconnected business transactions. With the “Magnificent Seven” accounting for a record one-third of the S&P 500, a retreat in this influential group could lead to significant downside in the index.
Portfolio Strategy: We remain cautious about the possibility of a near-term pullback due to a combination of risk factors such as slowing economic growth, tariff uncertainty, crowded positioning, and elevated valuations. While we acknowledge that the latter half of the fourth quarter has historically been one of the strongest periods for equity performance, a blowout rally in the last two months of 2025 only increases the risk of a substantial decline in 2026, in our view. In recent weeks, we have been focused on mitigating downside risk. As part of this strategy, on September 24, we rebalanced all client portfolios to book gains in profitable positions and bring overall portfolio asset allocation back to target weights. We also added two credit alternative ETFs to boost yield and hedge fixed income volatility.
Market Review – Rebound continues for fifth month
Global equities rallied for the fifth straight month in September, with several indices marching to new highs seemingly every other day, despite widespread expectations for a pullback. The rally was propelled by a bullish confluence of factors – expectations for continued robust earnings growth, a resumption of interest rate cuts, and ongoing enthusiasm for artificial intelligence (AI)-related stocks. While the few warning signs that have emerged so far in October have been brushed aside by the relentless rally, we believe a measure of caution is warranted as we head into year-end.
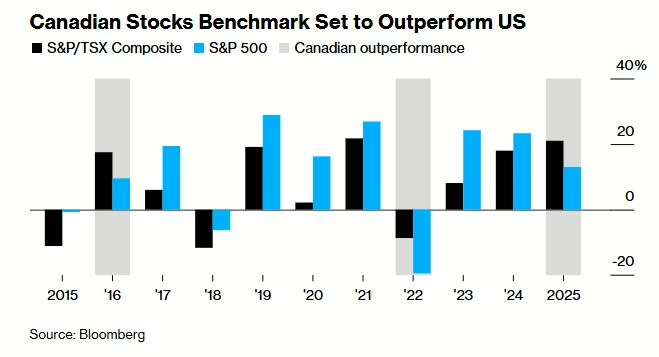
Canada: The TSX Composite rose 5.1% in September, setting a new closing record just above 30,000 on the last day of the month. The index’s 11.8% surge in Q3 was its best quarterly gain since the pandemic recovery in Q2 of 2020, and its 22.1% advance YTD (as of October 23, 2025) puts it on course for the biggest annual gain since the rebound from the global financial crisis in 2009. The index rally has been broad-based, with participation from multiple sectors. While the Materials group has soared 70% this year, led by gold and silver producers as bullion traded at record highs, other sectors that have gained at least 18% YTD include technology, utilities, financials, and consumer discretionary. The TSX is set to outperform the S&P 500 this year for the first time in an up year for both markets since 2016 (Figure 1).
United States: U.S. indices also had a good month, with the S&P 500 and Nasdaq Composite posting their best September performance in 15 years with gains of 3.5% and 5.6%, which contributed to a quarterly increase of 7.8% and 11.2% respectively. The Dow Jones Industrial Average (DJIA) rose 1.9% in September for a Q3 gain of 5.2%.
International: The Euro Stoxx 50 index rose 3.3% in September, for a gain of 4.3% in Q3. European indices were mixed, with several of them posting high single-digit increases in the quarter, while major markets like France and Germany lagged. Asian markets were broadly higher in Q3, as Taiwan, Hong Kong and Japan recorded double-digit gains; China’s SSE Composite’s 12.7% advance was its best quarterly performance in over six years. Overall, the MSCI AC World Index gained 3.5% in September for a Q3 gain of 7.6%.
(Sources: FactSet, Bloomberg)
Outlook – Earning growth propels rally into 4th year, but tariffs may bite in 2026
Bull market enters fourth year
The current bull market marked its third anniversary this month, having commenced in mid-October 2022. Over this three-year period, the Nasdaq Composite has soared 127% and the S&P 500 has surged 88%, while the TSX Composite and DJIA are up by a more sedate 65% and 62% respectively.
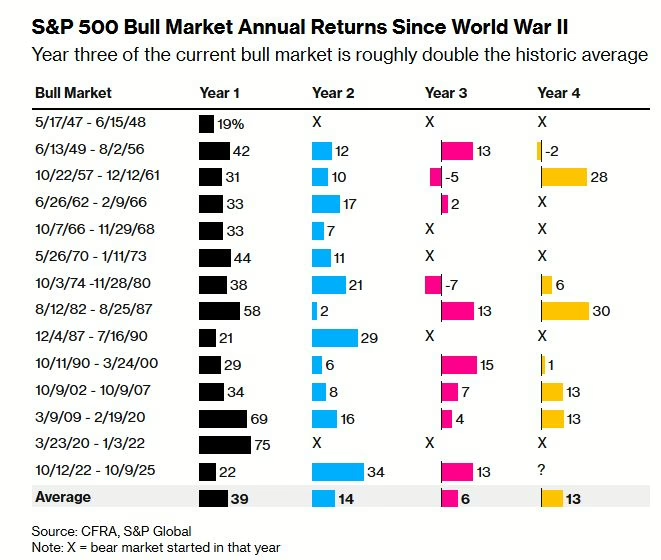
Can gains of that magnitude be sustained for a few more years? The evidence is mixed in this regard. As shown in the chart from CFRA Research (Figure 2), of the 13 prior bull markets in the S&P 500 since World War II, only seven completed a fourth year, with an average total gain of 88%. The S&P 500 has reached that threshold in just three years in the current bull market, with the index’s trailing price/earnings (P/E) ratio of 25 the highest ever at this stage of the rally.
Rally underpinned by strong earnings growth
But the rally does have strong underpinnings in terms of corporate earnings. According to FactSet, the S&P 500 is likely to report earnings growth above 13% for the third quarter, which would be the fourth straight quarter of double-digit earnings growth (Figure 3).
Data compiled by Bloomberg Intelligence shows that about 85% of S&P 500 companies that have reported Q3 earnings so far have exceeded profit estimates, the best performance since 2021. Although most S&P 500 firms typically beat profit estimates, the current quarter’s performance is noteworthy because analysts had already raised earnings projections heading into the reporting period.

It’s a similar story for the TSX Composite. Scotiabank strategists expect Q3 EPS for the index to exceed the $400 consensus forecast and even surpass the record of $405 achieved in Q2. For full-year 2025, EPS for the TSX is forecast at $1,643 (FactSet estimates), representing 11.3% growth from 2024. TSX EPS is forecast to jump 14% in 2026 to $1,872. On that basis, the TSX Composite’s forward earnings multiple (based on 2026 EPS) of 16.1x does not appear too rich.
Earnings growth estimates for the S&P 500 are on a similar trajectory, forecast to increase 11% this year to $266.18, and 14% in 2026 to $302.85. Based on those estimates, the S&P 500 is trading at a forward multiple (based on 2026 EPS) of 22.2x.
Will the disconnect persist?
So why are indices at record highs given that the Canadian and U.S. economies seem to be slowing down appreciably? The “disconnect” can be attributed to the following reasons.
- The TSX is dominated by cyclical sectors (i.e. sectors whose fortunes depend on the economic cycle) such as financials, materials (which now has the second-largest weight in the TSX), and energy. Financials and materials together comprise close to 50% of the index, and these two groups have been among the biggest contributors to TSX earnings growth, thanks to the resilient Canadian economy and record gold (and silver) prices respectively.
- The TSX may also be benefiting from expectations for additional rate cuts from the Bank of Canada, which could provide a shot-in-the-arm for the floundering Canadian economy, as well as proposed economic initiatives that could reinvigorate economic growth.
- Over in the U.S., the largest companies are global enterprises whose earnings are getting a tailwind from the 9% decline of the US dollar against major currencies. In addition, BMO GAM notes that President Trump’s signature “One Big Beautiful Bill Act” will have a positive impact on corporate earnings. The full immediate expensing of equipment, R&D and software takes the effective corporate tax rate down to 12%, and benefits the biggest U.S. sectors such as technology, communication services, and consumer discretionary (combined weight of 55% in the S&P 500) the most.
- Finally, in some sense the rebound from the April lows is more like a relief rally than anything else, since the worst-case outcomes (i.e. a full-blown trade war, global recession) resulting from the tariffs have been averted. But we may not be totally out of the woods yet.
Tariffs may impact global economy in 2026
The International Monetary Fund (IMF), in its recent outlook report, raised its 2025 growth estimate for the global economy to 3.2% (from 3% in July, Figure 4) due to temporary factors such as the weaker dollar, front-loading by companies and consumers as they stockpiled goods in anticipation of tariffs, and a boom in AI investment. However, growth is seen edging marginally lower to 3.1% in 2026 as tariffs begin to have an impact.
The World Trade Organization had a similar assessment recently, estimating that global goods trade will rise 2.4% this year after an unexpectedly resilient first half of 2025, thanks to a 20% jump in AI-related goods such as semiconductors, servers and telecom equipment. However, the WTO forecasts merchandise trade will slow down to a 0.5% growth pace in 2026, due to the delayed drag on international commerce from the tariffs.
Circular AI deals are concerning
The concentration risk posed by the handful of technology behemoths that have dominated this rally is well known. Lately, however, the wave of deals and partnerships between the biggest AI players including Nvidia and OpenAI have led to escalating concerns that the AI boom is being propped up by interconnected business transactions.
About a month ago, Nvidia agreed to invest $100 billion in OpenAI to help it fund a data-center buildout; OpenAI in turn committed to buying million of Nvidia chips. Earlier in October, OpenAI struck a partnership deal with Advanced Micro Devices (AMD) to deploy tens of billions of its chips, in exchange for which OpenAI could become one of AMD’s largest shareholders.
Such circular deals are concerning, coming as they are at a time when there are increasing worries that the AI boom could be a speculative bubble similar to the dot-com one of the late 1990s. With the “Magnificent Seven” accounting for a record one-third of the S&P 500, a retreat in this influential group could lead to significant downside in the index.

Portfolio Strategy
With equity indices hovering near all-time highs and priced for perfection, any unexpected development has the potential to derail the rally. On October 10, markets declined by the most since April on renewed concerns about a trade war between the U.S. and China.
But that blip proved to be short-lived. Investors’ expectations for a pullback last month, as noted earlier, have now given rise to complacency. As a result, we remain cautious about the possibility of a near-term pullback due to a combination of risk factors such as slowing economic growth, tariff uncertainty, crowded positioning, and elevated valuations. While we acknowledge that the latter half of the fourth quarter has historically been one of the strongest periods for equity performance, a blowout rally in the last two months of 2025 only increases the risk of a substantial decline in 2026, in our view.
In recent weeks, we have been focused on mitigating downside risk. As part of this strategy, on September 24, we rebalanced all client portfolios to book gains in profitable positions and bring overall portfolio asset allocation back to target weights.
In addition, we added two credit alternative ETFs to boost yield and hedge fixed income volatility. Specifically, we allocated 2% each to the Dynamic Short-Term Credit Plus ETF (DXCP) and the Picton Long Short Income Alternative ETF (PFIA). The purchases were funded by reducing the weight of our fixed income pool and the two fixed income ETFs held in our portfolios. With credit spreads at record lows, these changes should mitigate volatility in the bond market when spreads widen.
The Portfolio Management Team (PMT) will continue to make incremental changes to client portfolios to position them for changes in the markets and economy. In the weeks ahead, we will be reviewing asset allocation in client portfolios to ensure that they are adequately positioned for the market challenges of 2026.
To accompany this Portfolio Management Update, we’ve also posted our latest video, Bracing for a Correction, and the Q3 2025 Luft Financial Model Portfolios Update. If you haven’t viewed them yet, we recommend doing so, as together, all three provide a complete picture of recent market activity and the strategic adjustments we’re making to keep your portfolios balanced.
Please contact any member of the PMT if you have any questions or concerns regarding your accounts.
This information has been prepared by Elvis Picardo, who is a Portfolio Manager for iA Private Wealth Inc. and does not necessarily reflect the opinion of iA Private Wealth. The information contained in this newsletter comes from sources we believe reliable, but we cannot guarantee their accuracy or reliability. The opinions expressed are based on an analysis and interpretation dating from the date of publication and are subject to change without notice. Furthermore, they do not constitute an offer or solicitation to buy or sell any of the securities mentioned. The information contained herein may not apply to all types of investors. The Portfolio Manager can open accounts only in the provinces in which they are registered. iA Private Wealth Inc. is a member of the Canadian Investor Protection Fund and the Canadian Investment Regulatory Organization. iA Private Wealth is a trademark and business name under which iA Private Wealth Inc. operates.